Reports Overview, Driving Test Report and Vehicle Report
Applies to: school staff with Reports.View (Overview), plus DrivingTests.View (Driving Test Report) or Vehicles.View (Vehicle Report). Plan must include Reports. Last reviewed: 2026-11-18.
This page covers the operational side of reporting: the Reports Overview, the Driving Test Report and the Vehicle Report. Student, lesson, sign-off, instructor and financial reports have their own pages (links at the end).
The Reports menu
Sidebar > REPORTING > Reports. The group is shown to users with Reports.View when the school's plan includes the Reports feature.
| Menu item | Address | Extra permission |
|---|---|---|
| Overview | /reports |
none |
| Student Report | /reports/students |
Students.View |
| Lesson Report | /reports/lessons |
Lessons.View |
| Sign-Off Report | /reports/sign-offs |
Lessons.View |
| Driving Test Report | /reports/driving-tests |
DrivingTests.View |
| Financial Report | /reports/financial |
Payments.View |
| Vehicle Report | /reports/vehicles |
Vehicles.View |
| Instructor Earnings Report | /reports/instructor-earnings |
InstructorEarnings.View and the Instructor Earnings plan feature |
These eight are all the reports the application has. Opening a report address without the permissions shows "You don't have access to this report - Ask an administrator for access if you need it." with a Reports button. A SuperAdmin has no Reports menu, because a SuperAdmin belongs to no school.
Filters shared by every report
| Control | Meaning |
|---|---|
| From / To | The period. Both dates are included in full. |
| Branch | All branches or one branch. Inactive branches are listed too. |
| Period | Quick ranges, counted from today: Today, This week (Monday to today), This month (1st to today), Last month, Last 30 days, Last 90 days, Year to date, Last year. Choosing one sets the dates and runs the report. |
| Generate Report | Runs the report with the dates and branch in the boxes. |
- The period and branch are remembered while you move between report pages in the same session. The first time they are one month ago to today, all branches.
- "Please select a date range." appears when a date is empty; "The start date cannot be after the end date." when they are the wrong way round.
- A user whose sign-in is tied to one branch only ever gets that branch's data, whatever the Branch box says.
- Parts of a report marked "as of today" ignore the period. Parts marked "in selected period" follow it.
Reports Overview
Sidebar > REPORTING > Reports > Overview. Page title Reports, subtitle "Business performance and operational insights." Needs Reports.View only.
The page generates itself when opened. Before the first result it shows "No report generated - Select a date range and generate a report."
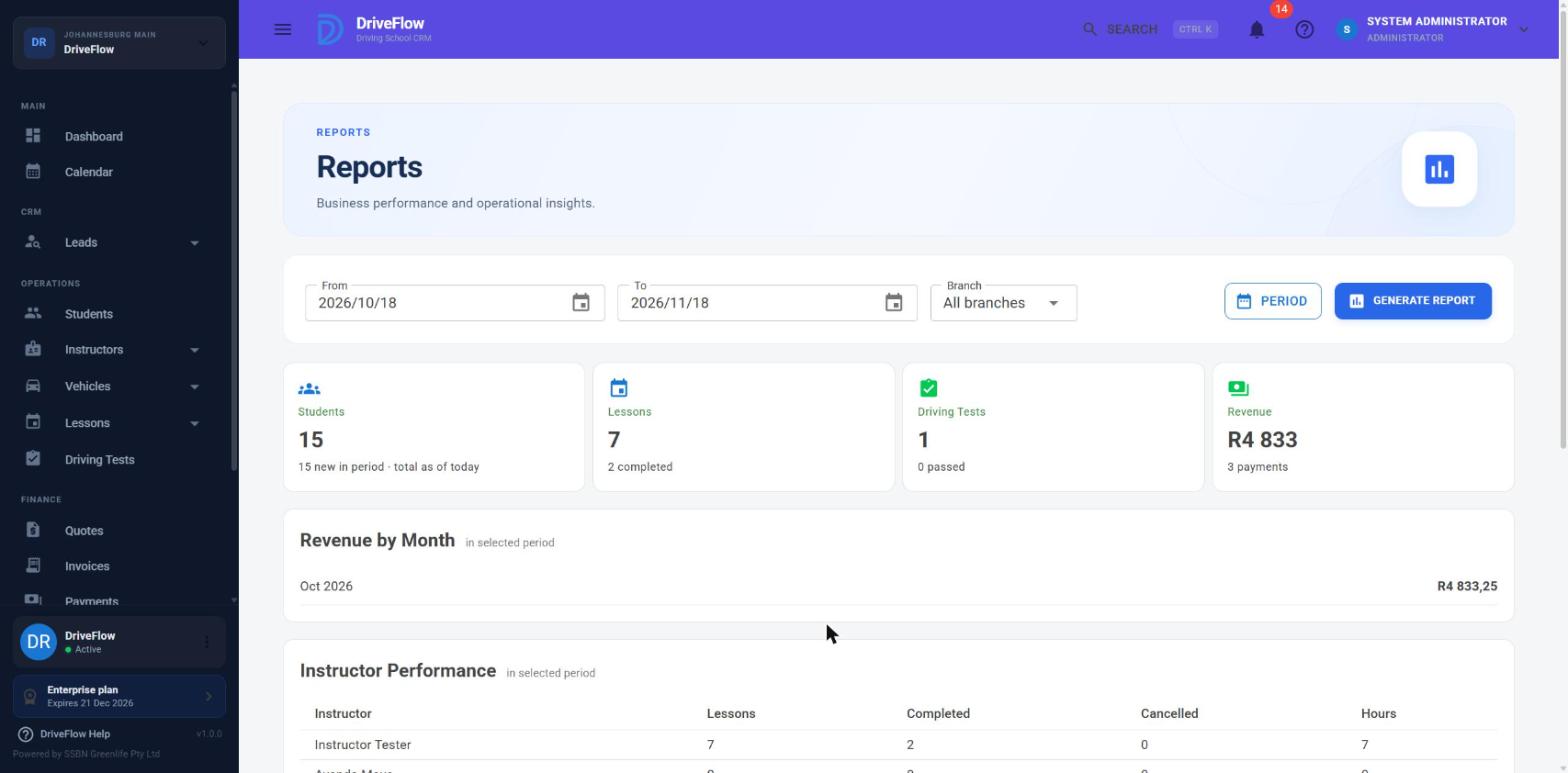
KPI cards
| Card | Figure | Sub-text | How it is calculated |
|---|---|---|---|
| Students | Total students | "n new in period · total as of today" | Total: all students (of the branch) today. New: students created within the period. |
| Lessons | Total lessons | "n completed" | Lessons starting in the period, every status. Completed: status Completed. |
| Driving Tests | Total tests | "n passed" | Tests dated in the period, every status. Passed: result Passed. |
| Revenue | Rand amount, no cents | "n payments" | Sum and number of Successful payments dated in the period. Only with Payments.View. |
Revenue by Month (in selected period)
Only with Payments.View. One line per month in the period that has payments: month and money received.
Instructor Performance (in selected period)
Only with Instructors.View. Columns Instructor, Lessons, Completed, Cancelled, Hours. Described in Instructor reports.
Vehicle Utilisation (in selected period)
Only with Vehicles.View.
| Column | Meaning |
|---|---|
| Vehicle | Vehicle number. |
| Registration | |
| Lessons | Lessons with this vehicle starting in the period, every status. |
| Tests | Driving tests with this vehicle dated in the period. |
| Hours | Time of the non-cancelled lessons with this vehicle. |
| Mileage | The vehicle's current odometer reading in km (today's value, not the distance driven in the period). |
Sorted by most lessons. With a branch selected, the list holds that branch's vehicles and vehicles shared with all branches.
Permissions inside the Overview
The server blanks what a user may not see, so the figures are not merely hidden:
| Without | Removed |
|---|---|
Payments.View |
Revenue card, Revenue by Month (revenue, payment count and outstanding balance are sent as zero) |
Instructors.View |
Instructor Performance |
Vehicles.View |
Vehicle Utilisation |
Note
The Students, Lessons and Driving Tests cards are shown to everyone with Reports.View, even without Students.View, Lessons.View or DrivingTests.View.
The Overview has no export.
Example
Period: Last 30 days. Students 214 ("18 new in period · total as of today"), Lessons 412 ("356 completed"), Driving Tests 22 ("15 passed"), Revenue R 86 400 ("143 payments"). In the last 30 days 18 students joined, 412 lessons were planned of which 356 were completed, 15 of 22 tests were passed and R 86 400 was received in 143 payments.
Driving Test Report
Sidebar > REPORTING > Reports > Driving Test Report (/reports/driving-tests). Subtitle "Test activity, pass rates and instructor performance." Needs Reports.View and DrivingTests.View.
A test belongs to the period by its test date. With a branch selected, the test's branch is used. Everything on this page follows the period.
Screenshot to be added
Screen: Driving Test Report. Should show: summary cards, Overall Pass Rate and Results by Licence Code.
Summary cards
| Card | How it is calculated |
|---|---|
| Total Tests | All tests dated in the period, every status. |
| Passed | Tests with result Passed; below it "x% pass rate". |
| Failed | Tests with result Failed. |
| Booked | Tests with status Booked (no result yet). |
Overall Pass Rate
"Based on completed tests in the selected period."
Booked and cancelled tests are left out of the rate. With no passed or failed tests the rate is 0.
Results by Licence Code
Grouped by the student's licence code, most tests first: Licence, Total Tests, Passed, Failed, Pass Rate. Tests of students without a licence code are not listed.
Instructor Test Performance
Grouped by the instructor on the test, best pass rate first: Instructor, Tests, Passed, Failed, Pass Rate. Tests without an instructor are not listed.
Testing Centre Performance
Grouped by testing centre, best pass rate first: Testing Centre, Tests, Passed, Failed, Pass Rate.
Daily Test Activity
One row per day with tests: Date, Total, Passed, Failed, Booked, Pass Rate.
Test Details
Newest first.
| Column | Meaning |
|---|---|
| Test | Test number. |
| Date | Test date and time. |
| Student | |
| Instructor | Empty when none was assigned. |
| Vehicle | Vehicle number; empty when none. |
| Licence | The student's licence code. |
| Testing Centre | |
| Status | The result (Passed, Failed) when there is one, otherwise the test's status (Booked, Cancelled, ...). |
Example
Period: Last month. Total Tests 22, Passed 15 (75.0% pass rate), Failed 5, Booked 0. Fifteen of the twenty tests with a result were passed; the other two tests were cancelled or have another status. In Testing Centre Performance, "Randburg - Tests 9 - Passed 8 - Failed 1 - Pass Rate 88.9%" shows where students do best.
Export
Export > Excel, PDF or CSV. The file holds the Test Details rows for the period and branch, with columns TestNumber, TestDate, StudentName, InstructorName, Vehicle, LicenceCode, TestingCentre, Status. See Exporting reports. Messages: "Unable to generate driving test report.", "Unable to export driving test report.".
Vehicle Report
Sidebar > REPORTING > Reports > Vehicle Report (/reports/vehicles). Subtitle "Vehicle usage, availability, compliance and fleet overview." Needs Reports.View and Vehicles.View.
The page says: "Lessons and driving tests in the selected period. Fleet counts and compliance above and below are as of today." Only the Usage figures and the Lessons, Hours and Tests columns follow the period.
With a branch selected, the vehicles are those of that branch plus vehicles available to all branches, and usage counts lessons and tests at that branch.
Screenshot to be added
Screen: Vehicle Report. Should show: fleet cards, Usage, Compliance and the Vehicle Details table.
Fleet cards (as of today)
| Card | How it is calculated |
|---|---|
| Total Vehicles | All vehicles that are not deleted, whatever their status (sold vehicles included). |
| Active | Status Active. |
| Maintenance | Status Maintenance. |
| Inactive | Status OutOfService. |
Usage (selected period)
| Figure | How it is calculated |
|---|---|
| Lessons | Lessons in the period, added up over the listed vehicles (every status, cancelled lessons included). |
| Training Hours | Time of the non-cancelled lessons, added up over the listed vehicles. |
| Driving Tests | Tests in the period, added up over the listed vehicles. |
Compliance (as of today)
"Vehicle documents requiring attention." For Insurance, Roadworthy and Licence Disc:
- "n expired": vehicles whose expiry date is before today;
- the second number: vehicles whose expiry date is today or within the next 30 days.
Vehicles without a date for a document are not counted for that document.
Licence Codes, Transmission, Fuel Type (as of today)
- Licence Codes: number of vehicles per licence code. A vehicle with two codes is counted under both.
- Transmission and Fuel Type: number of vehicles and share of Total Vehicles (1 decimal).
Vehicle Details
In vehicle-number order.
| Column | Meaning |
|---|---|
| Vehicle | Vehicle number. |
| Registration | |
| Make / Model | With the year. |
| Licence | Licence codes the vehicle is used for. |
| Transmission | |
| Mileage | Current odometer reading. |
| Lessons | Lessons with this vehicle in the period (every status). |
| Hours | Time of its non-cancelled lessons in the period. |
| Tests | Driving tests with this vehicle in the period. |
| Insurance, Roadworthy, Licence Disc | Expiry dates. |
| Status | Vehicle status. |
Example
Period: This month. Total Vehicles 8, Active 6, Maintenance 1, Inactive 1. Usage: Lessons 240, Training Hours 228.5 h, Driving Tests 9. Compliance: Roadworthy "1 expired" and 2 expiring. One vehicle's roadworthy certificate has lapsed and two more lapse within 30 days. In Vehicle Details, a vehicle with Lessons 2 next to others with 40 is hardly being used.
Export
Export > Excel, PDF or CSV. The file holds the Vehicle Details rows with columns VehicleNumber, RegistrationNumber, Make, Model, Year, Colour, LicenceCode, Transmission, FuelType, CurrentMileage, InsuranceExpiry, RoadworthyExpiry, LicenseDiscExpiry, Status, Lessons, DrivingTests, TotalHours. The file is titled "Vehicle Utilization Report". See Exporting reports. Messages: "Unable to generate vehicle report.", "Unable to export vehicle report.".
Limitations and notes
- No kilometres per period. Mileage is the current odometer reading. Distance, fuel and cost reporting belong to Fleet Management (Enterprise), which has its own page; see the vehicle and fleet documentation.
- Lessons counts include cancelled lessons; Hours do not.
- Sold vehicles are in Total Vehicles and in the detail list. The header's vehicle notifications ignore sold vehicles; this report does not.
- Two vehicle endpoints, one screen. The page loads its data from
api/reports/vehiclesand exports throughapi/reports/vehicles/utilization/export; both produce the same report.GET api/reports/vehicles/utilization(without export) is not called by any page. - Reports are not limited to an instructor's own lessons or tests when an instructor is given
Reports.View. - No charts on these pages; all figures are cards, lists and tables.
- No saved reports, schedules or emailed reports. A background job named "report-generation" runs nightly but only writes a log line; see Financial Report.
- The Overview cannot be exported.
Related articles
- Dashboard and header - today's figures at a glance
- Student Report - student numbers and progress
- Lesson Report - lessons and training hours
- Sign-Off Report - signed lessons
- Instructor reports - per-instructor figures and earnings
- Exporting reports - Excel, PDF and CSV files
The Financial reports page covers the Financial Report.